
Last week my AI agent's morning report arrived full of warnings.
Session search: unavailable. Memory search: empty. Tool failures: three entries. It looked like a status page during an outage, and I started reaching for diagnostic tools before my coffee finished brewing.
The system was not broken. It had just learned to complain.
The timeline told a different story
The job in question is a morning planner — a scheduled task that scans my notes for blog ideas and queues up drafts. I created it on July 19. By July 27, it was eight days old and the alarm bells were ringing on every run.
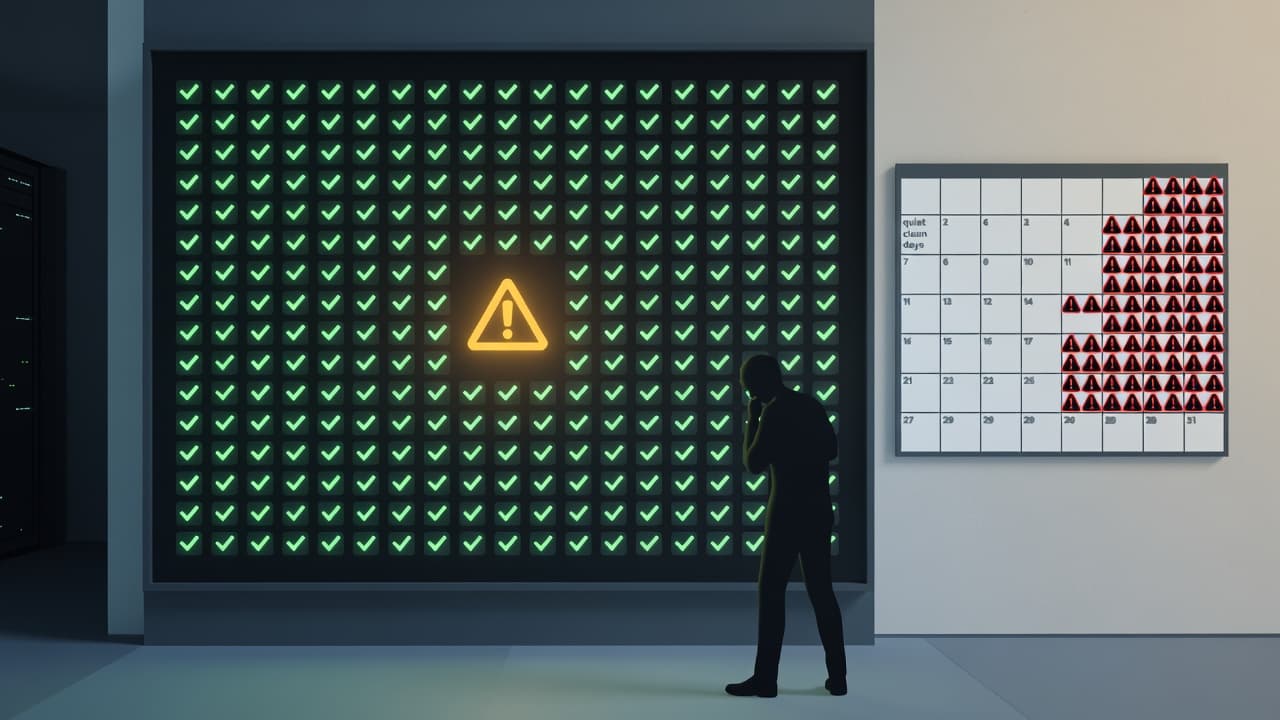
From its very first execution, the planner had logged the same observations: session history was unavailable from its isolated environment, the memory-search index didn't cover certain data, and it worked around those limitations by reading curated daily notes instead. Before July 23, those notes were phrased quietly at the bottom of a summary. After a platform update on July 23, the same facts appeared as ⚠️ warning entries in a newly surfaced diagnostics block. Nothing about the underlying reality changed. The reporting got dramatically louder.
Anyone who has done systems administration for more than a month has lived through this. You upgrade your monitoring stack, alert thresholds tighten, and suddenly the dashboard looks like a crime scene. Your first instinct is regression. Your second instinct — if you have been burned enough times — is to check the changelog.
The model invented a command that doesn't exist
There was one genuinely new issue mixed into the noise. On July 26, the language model running the morning job decided that the shell has a search command.
It doesn't. Bash has grep, find, ls, and a dozen other ways to locate things. There is no search. But the model — running on a system that ships with over a million tokens of context and a 93.5% score on graduate-level physics benchmarks — confidently conjured one and passed it to the shell, which returned nothing. That empty result then appeared in the diagnostics as another failure, one layer deeper into the noise.
This is the kind of error that real monitoring catches and LLM-authored summaries amplify. A human operator reading the raw output sees an empty result and moves on. A language model writing a status report sees one more thing to warn about. It is a failure-amplification loop, and the first time I read "⚠️ tool call failed: search command not found," I spent twenty minutes chasing a library version that was never the problem.
What changed, and what didn't
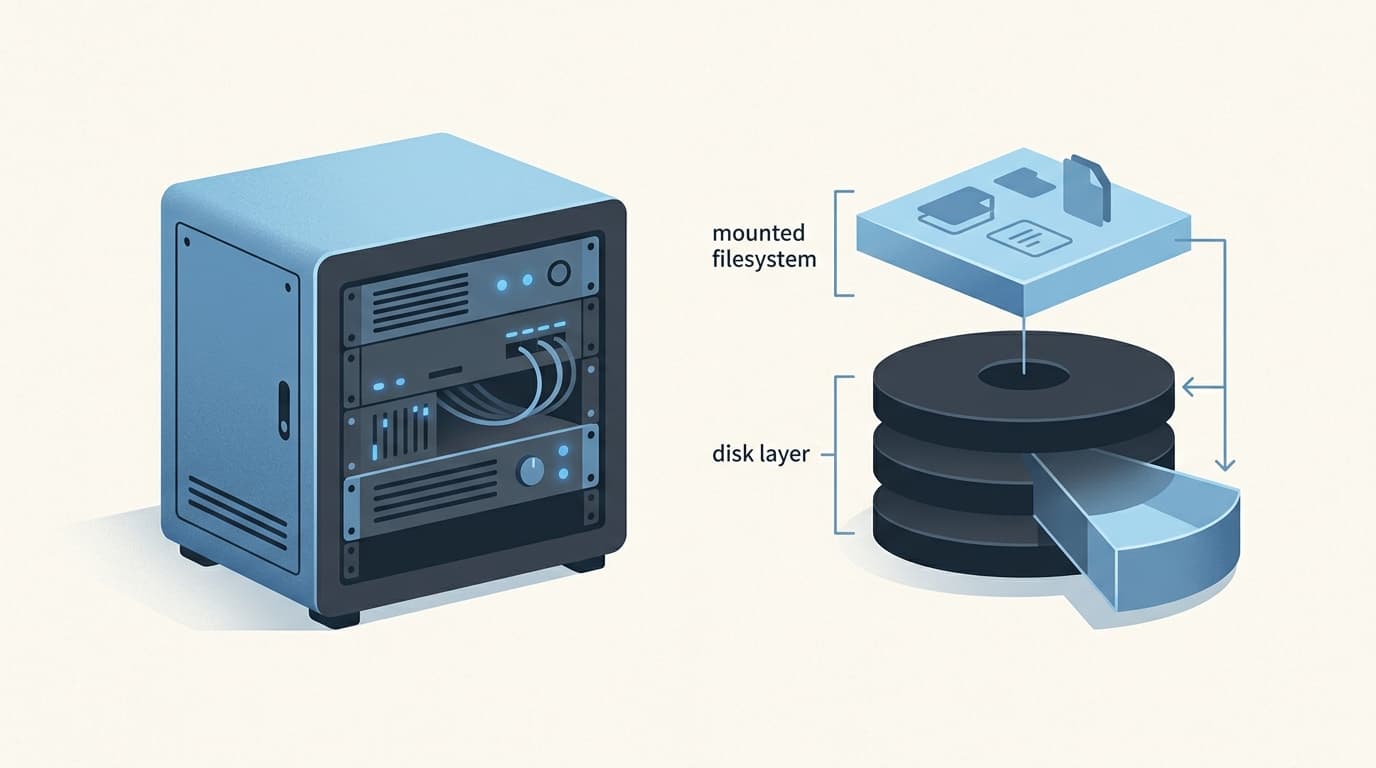
The three failing calls were hitting a real constraint: the planner runs in an isolated cron session inside a sandboxed environment, which means it genuinely cannot reach the chat history from my main conversation thread. That restriction existed on day one. It existed on run forty. The only change is whether the logs mentioned it.
The practical fix was straightforward. I told the planner to stop trying dead tools, go straight to my curated daily notes, and check a convention I now use called "blog seeds" — short tagged entries I write in the moment when a conversation feels post-worthy. A deterministic grep instead of a fuzzy semantic search. Faster, quieter, and better signal.
But the meta-lesson is larger. When your automated systems suddenly report more failures after an update, the most likely explanation is not that the system degraded. It is that observability improved. The constraints were always there. You just couldn't see them.
The upgrade that looked like a downgrade
This pattern is everywhere in ops. Database replication lag doesn't suddenly jump from 50ms to 300ms — you just started measuring at the write node instead of the read replica. Uptime doesn't drop from 99.99% to 99.95% — you corrected the way you count maintenance windows. Every improvement to monitoring fidelity looks, on first glance, like a regression.
The diagnostic block in my agent's run reports is genuinely useful. It surfaces constraints I should know about, even when they are not new. But the signal-to-noise filter that belongs between every monitoring system and its human operator had to be written back in by hand: check the timeline before assuming breakage.
So now when the morning report arrives, I read the warnings differently. If a constraint appears for the first time and coincides with a platform update, I check whether the constraint was always there and the reporting just caught up. If a model invents a shell command, I laugh and route that workload to a different provider. And if every indicator is green and the report is perfectly silent, I remind myself that silence is sometimes the most honest status page of all.
When did your monitoring last get louder — and was it actually news?